
TRADE SIMULATOR
Get the reps. Skip the tuition.
Rewind to a date you have never seen and trade it forward, bar by bar, with a real order ticket and a paper balance. A month of reps in an evening - before a live account is anywhere near it.
Real historical bars, simulated fills. Results are hypothetical and do not represent actual returns.
Order types on the ticket
Dollars at risk
Step size, if you want it
Paper balance, resettable
Screen time is the only thing that makes a setup obvious. Buying it with a funded account is the expensive way.
BEFORE YOU FUND
Learn the mechanics on paper
Order types, stop placement, sizing and closing a position are muscle memory. There is no reason to buy that muscle memory with a funded account.
NO HINDSIGHT
You cannot see the right-hand side
Land on a random date and the chart stops at the bar you are on. Every decision is made with the same information you will have live.
VOLUME
A month of setups in an evening
Live markets hand you a handful of chances a week. Historical bars hand you as many as you have patience for, in whatever order you choose.
TRANSFER
Practise the specific fix
Whatever the journal named and the replay showed you - late entries, early exits, no stop - is a drill you can run until it is boring.
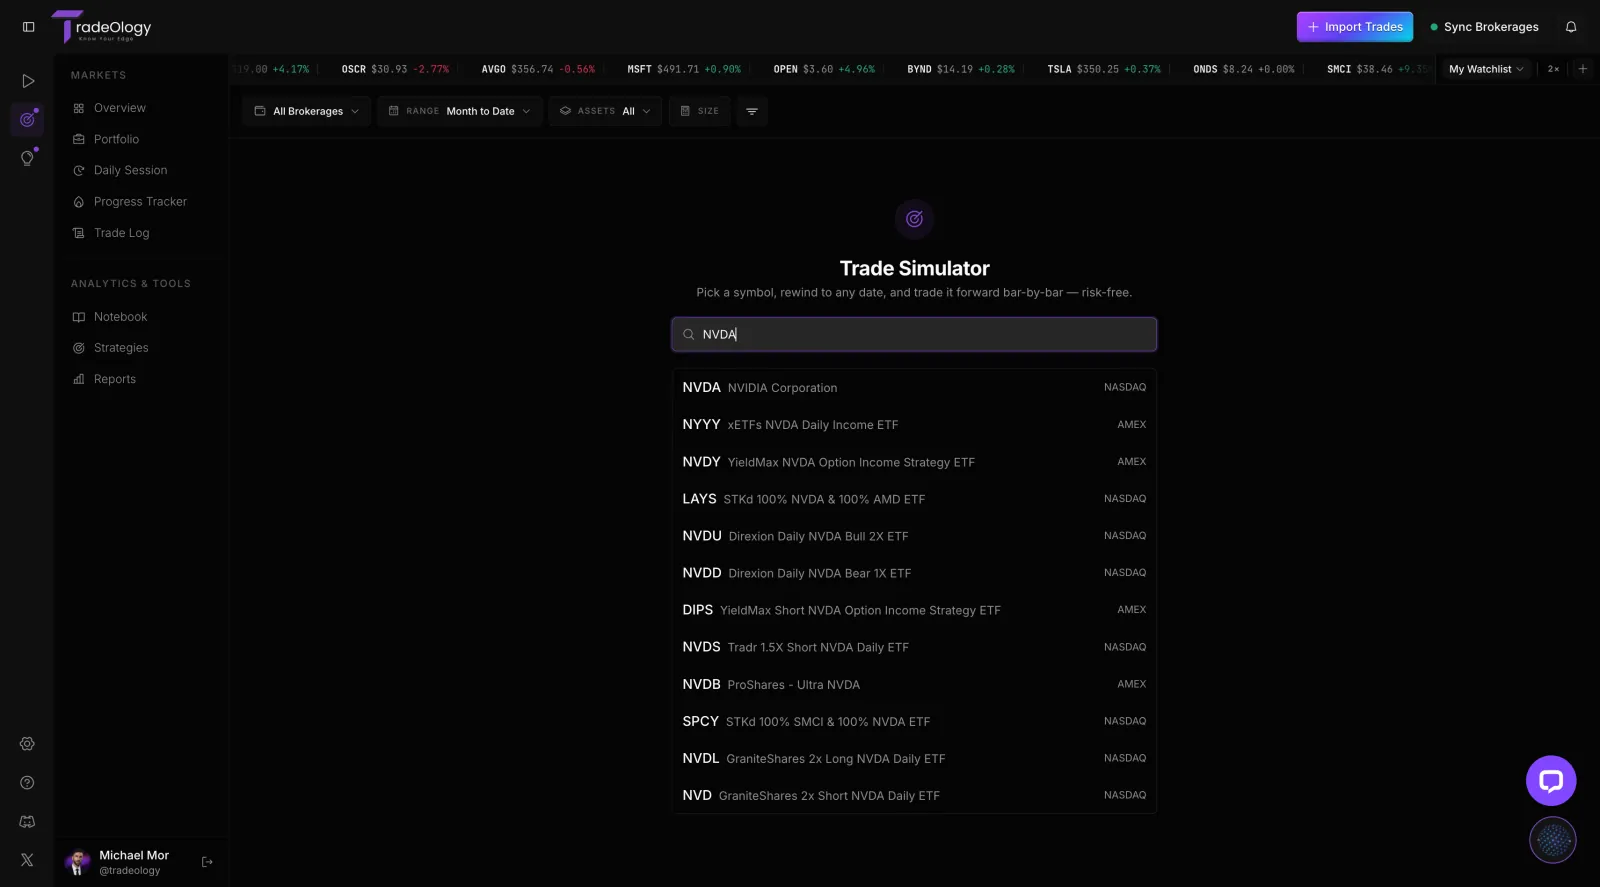
Pick a symbol, rewind to a date
Search the symbol, choose the date you want to trade - or take a random one and go in blind.
The random date is the honest setting. Trading a day you already remember is not practice, it is recall.
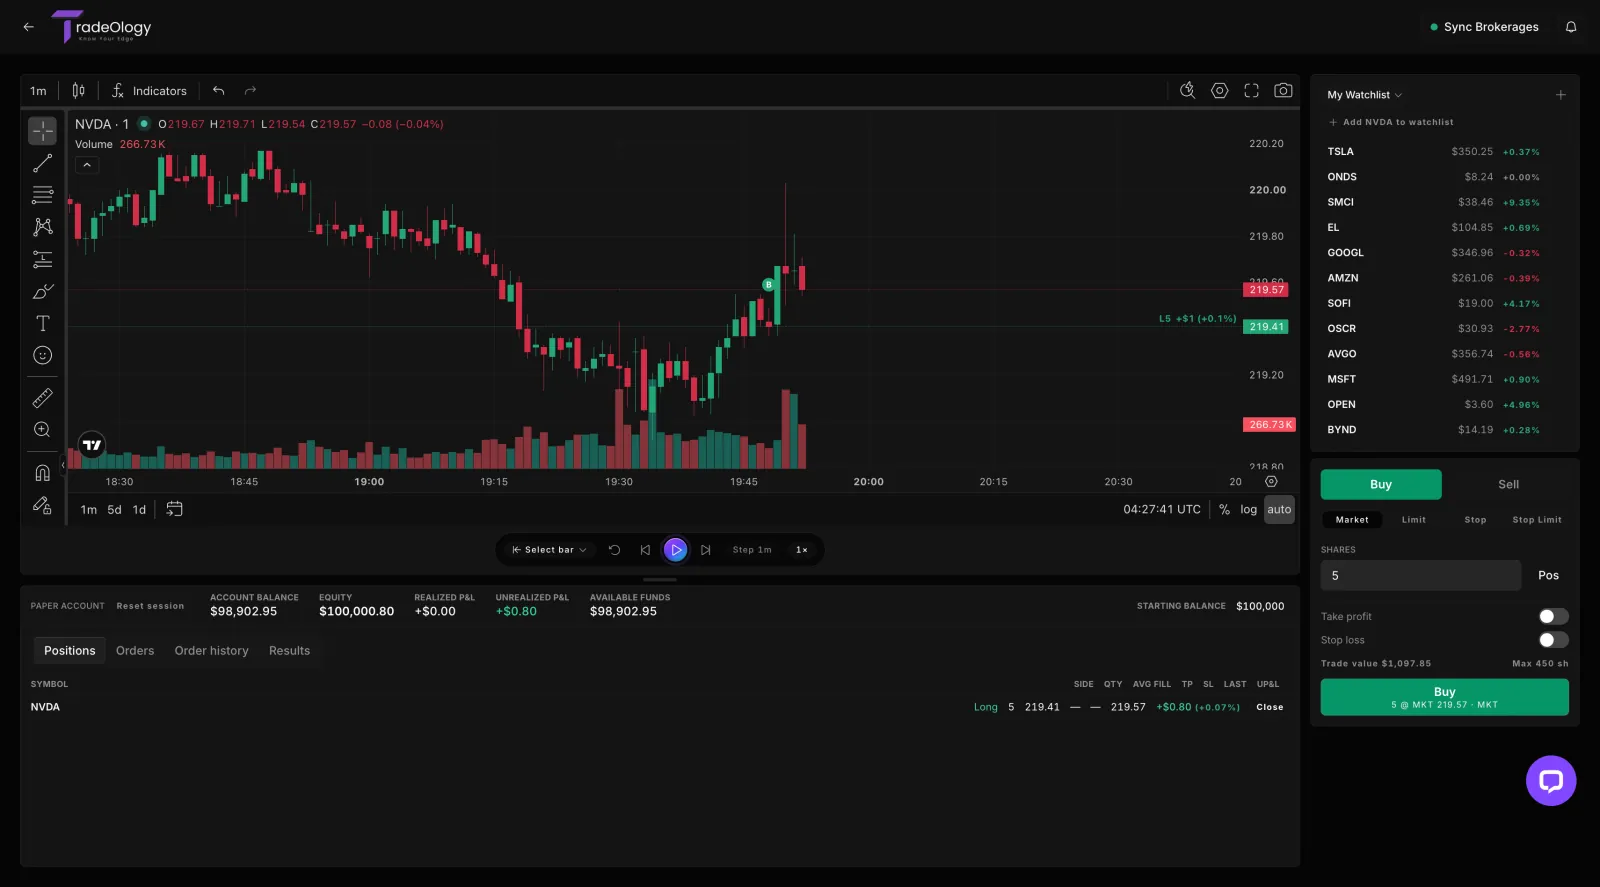
A real order ticket on printing bars
Buy and sell with market, limit, stop and stop-limit orders while the bars advance at your pace.
Stepping one bar at a time is where the learning is. It is also where you find out how many of your entries only look good three bars later.
WHILE THE BARS PRINT
Everything a live ticket asks of you, minus the money

Live P&L on every bar
Realized and unrealized P&L, equity and available funds update as each bar prints, so a position that is quietly bleeding looks like one.

Fills that behave
Limits fill when price trades through them, stops trigger on the bar that takes them out. Orders sit in the book until the market reaches them.

Position management
Add, trim or close from the positions table. Multiple positions can run at once, exactly as they would on a busy morning.

Your own layout
Indicators, drawings, timeframes and watchlist are the same chart tools as the rest of TradeOlogy - practise in the environment you review in.
THE REPS ADD UP
Every session is scored and kept
Practice you cannot measure is just screen time. Each session closes with a result, and the sessions stack into a curve you can read the same way you read your live account.
Simulated results are hypothetical. They show whether your process is repeatable, not what a funded account would have paid.
Session result
Each session closes with realized P&L, win rate and the trade list that produced them - the same shape as a live day in the journal.
Saved, not discarded
Sessions are kept, so last week's reps are still there to compare against this week's instead of evaporating when you close the tab.
Equity curve across sessions
The curve is the point. One good session is noise; a curve that climbs across twenty of them is a process worth funding.
Reset when you want
Reset the paper balance and start the drill over. The record of what you did stays.
HOW TO PRACTISE
An hour of reps that actually transfers
Pick one thing to drill
One setup, or one mechanic - stop before the fill, half off at 1R, no entries in the first five minutes. Not "get better at trading".
Write it down before you press play, or you will drift into whatever the chart offers.
Take twenty reps blind
Random dates, same drill, no peeking at the outcome before you commit. Step the bars rather than letting them run.
Twenty reps of one thing beats two hundred random clicks.
Read the session, then repeat
Look at the result and the trade list, not the P&L alone. Did you follow the rule on all twenty, or on the easy fourteen?
When the curve across sessions stops sagging, take it live small.
The first one I actually keep open.
"I've tried three journals and two Notion templates. This is the first one I have open all day. The Schwab sync runs on its own every morning, so by the time I sit down the log is already written and tagged. The reports are the real reason I stayed. Being able to split by setup, session and time held told me which of my strategies was quietly losing money - I cut it and my numbers moved that month."

David K. · New York, NY · Jul 28, 2026
Simulator questions
Historical bars. You rewind to a date and trade forward from it, which is what makes volume possible - you are not waiting for the market to open, and you can run twenty sessions in an evening.
Take a hundred trades tonight
Pick a symbol, land on a date you have never seen, and find out whether the setup holds up when you cannot see the right-hand side of the chart.